The world around us is constantly changing: forests are being cut down, cities are expanding, riverbeds shift, and natural disasters leave deep marks. To make informed decisions in ecology, urban planning, agriculture, or safety, it's important to know not only what exists now - but also what has changed and when.
This is exactly what Change Detection methodology is for - a powerful analytical tool that helps visualize changes in a given area by comparing satellite, aerial, or geospatial data from different points in time.
Why different map types matter: 2D, 2.5D, and 3D
-
- 2D maps are flat view showing only the surface area of objects. They help detect new constructions, expanded fields, or deforestation – but don’t provide any height or volume information.
- 2.5D maps, such as Digital Surface Models (DSM), add height data. With these, you can see that a forest not only shrank in area but also became lower – which means biomass has been lost.
- 3D maps provide full spatial context: you can see building heights, terrain shape, and changes after earthquakes or landslides. This is crucial for urban planning, mining monitoring, public safety, and environmental protection.
Where the Data Comes From: Which satellites for which tasks
Sentinel-2 (European Space Agency)
-
- Resolution: 10 meters
- Revisit time: Every 5 days
- Free of charge, ideal for monitoring large territories and general change trends.
Commercial high-resolution imagery (e.g., Pleiades, WorldView)
-
- Resolution: 0.3-0.5 meters
- Revisit time: On demand
- Very detailed - ideal for spotting small buildings, narrow roads, minor clearings. Perfect for urban analysis or verifying change detection results.
How to choose?
-
- Use Sentinel-2 for frequent, general monitoring.
- Use Pleiades / WorldView for precise detection of small changes or validation of results.
Change Detection Methods: from basic to advanced
1. Algebraic methods
-
- NDVI Differencing - compares vegetation indices to detect deforestation, fires, or crop diseases.
- Image Differencing - pixel-by-pixel comparison between two dates.
- Suitable for quick change assessment over large areas.
2. Classified image comparison
-
- Each image is processed (e.g., with Random Forest or SVM algorithms), land cover classes are identified (e.g., forest, urban, water), and then compared.
- Shows exactly what changed.
- Requires training data but delivers high accuracy.
3. Vector-based methods (CVA, MAD)
-
- Detect changes in pixel spectral characteristics.
- Great when it's important to know that a change occurred, even if its nature is unclear.
4. AI & Machine Learning
-
- Used for analyzing large areas or detecting small-scale changes.
- Neural networks (e.g., CNNs, U-Net) can achieve exceptional accuracy.
5. Trend analysis (time series)
-
- Ideal for gradual changes, such as forest degradation.
- Methods include BFAST, LandTrendr, and CCDC.
6. Post-Classification comparison
-
- Compares fully classified thematic maps from different dates.
- Precisely shows land cover changes (e.g., from “forest” to “agriculture”).
- Works even with different satellite sources, seasons, or time intervals – great for long-term change analysis.
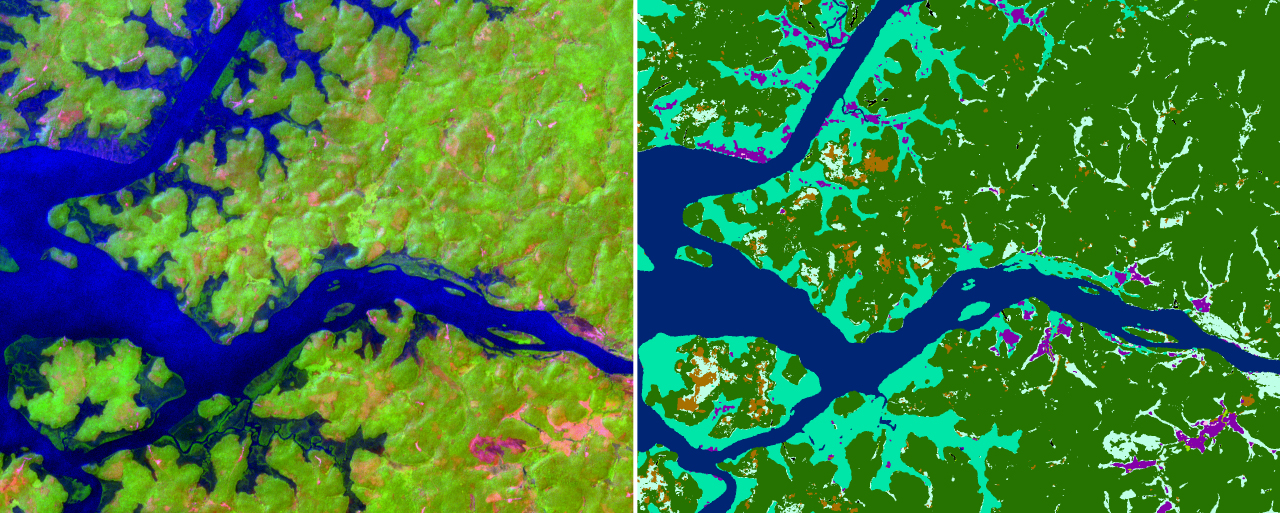
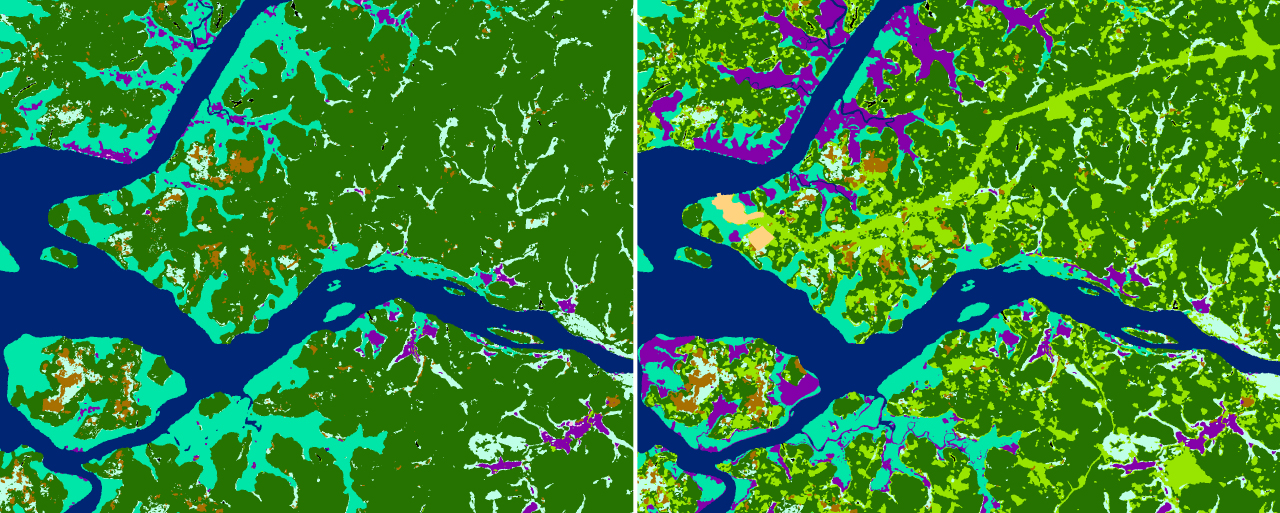
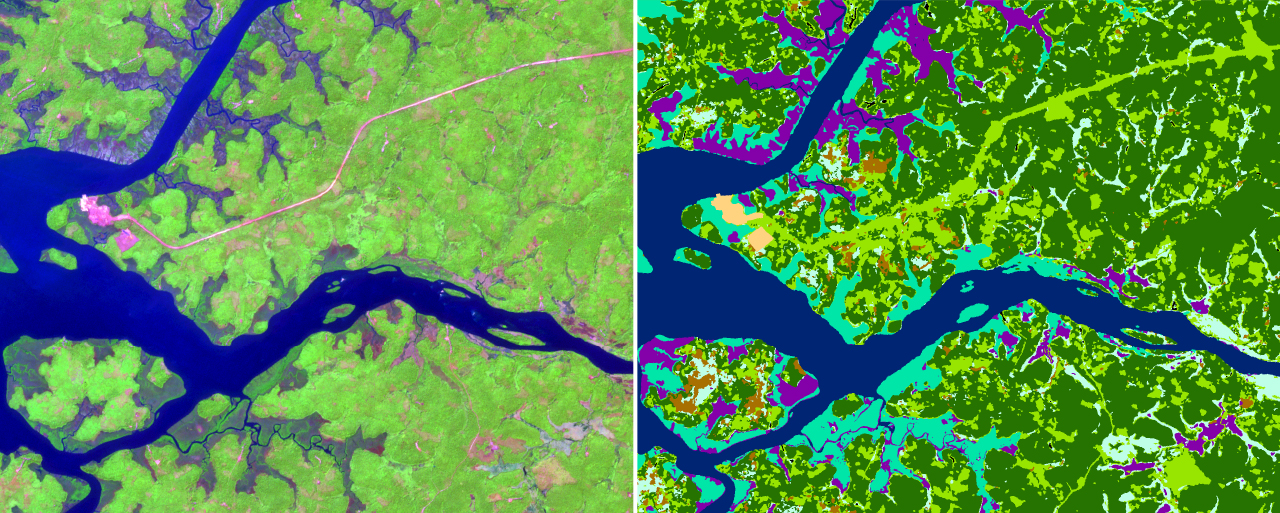
Comparison of forest conditions in 2023 using Change Detection technology
How VISICOM applies these technologies
Using AI-based algorithms and its own CNN neural networks, VISICOM can automatically:
-
- Identify up to 12 key land cover types
- Estimate object height from a single image
- Analyze multi-year imagery to detect changes: deforestation, flooding, fires, crop disease
- Perform quantitative area analysis and forecast future changes
2D, 2.5D, and 3D maps are no longer just visual aids - they’re decision-making tools. Changes in the environment are signals that require timely response.
Want to know where and when changes occurred in your area?
Need detailed analysis for your project?
VISICOM has the data and expertise to help you see those changes - and use that knowledge wisely.

