The events of recent years show that, particularly in Ukraine and globally in the world, the demands in wood have been significantly increased. Because of that, many uncontrolled and unauthorized loggings appeared. Thereby we see a stunning decrease of forest areas and as a result a shortening of the naturals lungs of the Earth. Consequently, this leads to crucial changes in climate and the emergence of floods, storms, soil erosions, etc.
In order to prevent a mass logging and to monitor the number of forestry areas at a state level, it is essential to know the forestry dynamic, it means to monitor all potential changes from year to year. However, there is a question:
- How to handle such a huge volume of work at a cost-effective price?
Visicom company has developed and successfully implemented the technology aimed at constant monitoring of forestry areas and vegetation within urban areas based on satellite images. Below, we are presenting this approach, which can be deployed either at the local level or at the nationwide level. The proposed technology allows us to preserve the green spaces and to save significant amounts of money, which may have been invested in the deployment of such a monitoring/tracking system.
1. SATELLITE IMAGES
Depending on the final model's accuracy demands (national, regional, city, local) the images of the various resolution starting from 0.5m (the most accurate data for city and local usage) up to 10m (for national and regional usage) can be used for the mapping of forestry and agriculture areas, city infrastructure, environmental solar/wind energy production projects, etc.
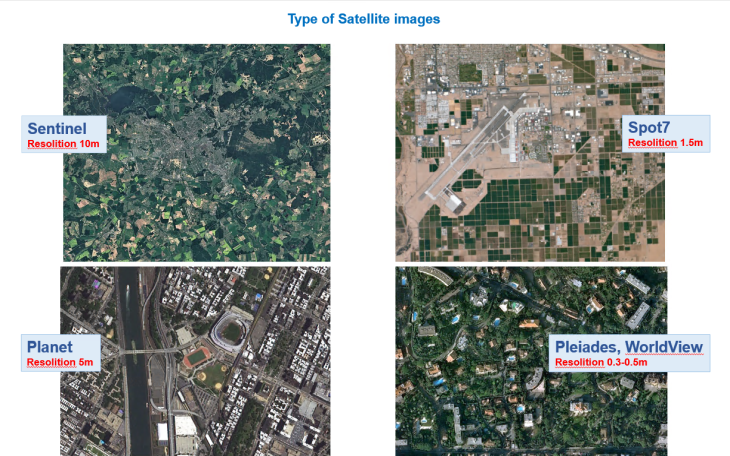 Image 2, Satellite types
2. FEATURES DETECTION AT THE NATIONAL OR REGIONAL SCALE LEVEL
The task list might include the following:
- establishment and maintenance of the national (regional) forest DB;
- vegetation registration;
- logging and planting planning;
- other,
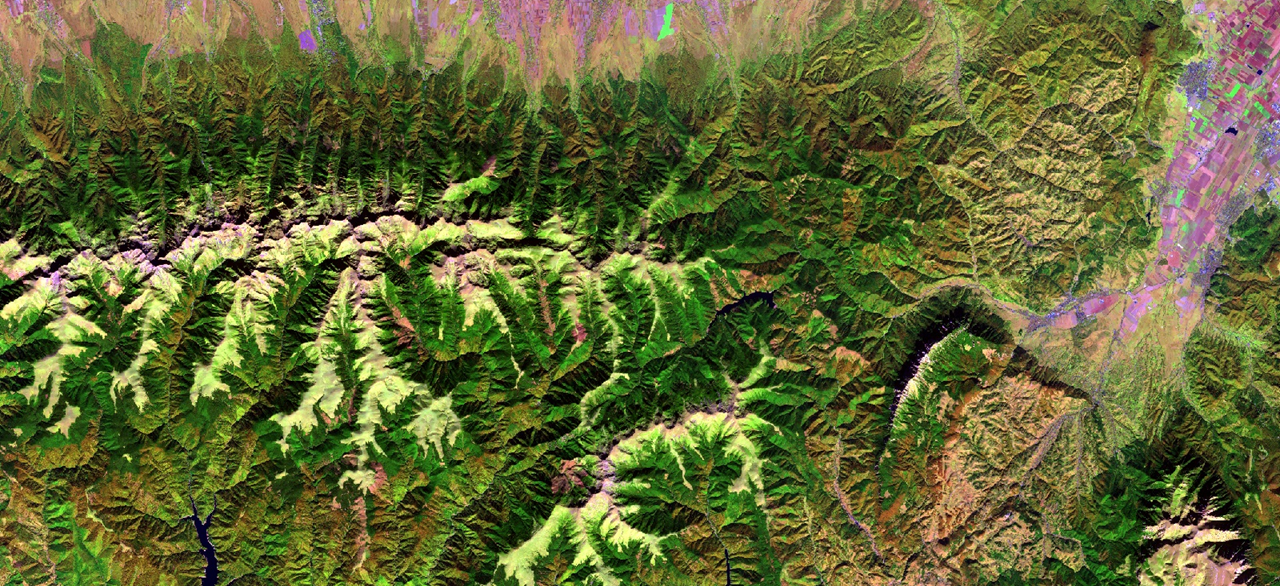
depending on the demands, the proposed approach includes vegetation areas detection based on satellite images (the picture below depicts the Sentinel image) and further calculation of areas according to regular forest types (foliar, coniferous, mixed)
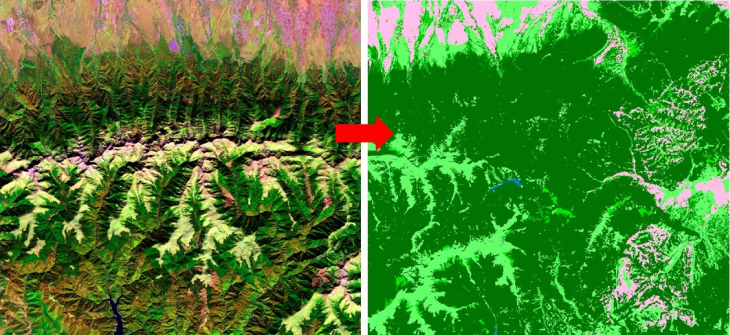
Image 3, Vegetation detection using satellite images
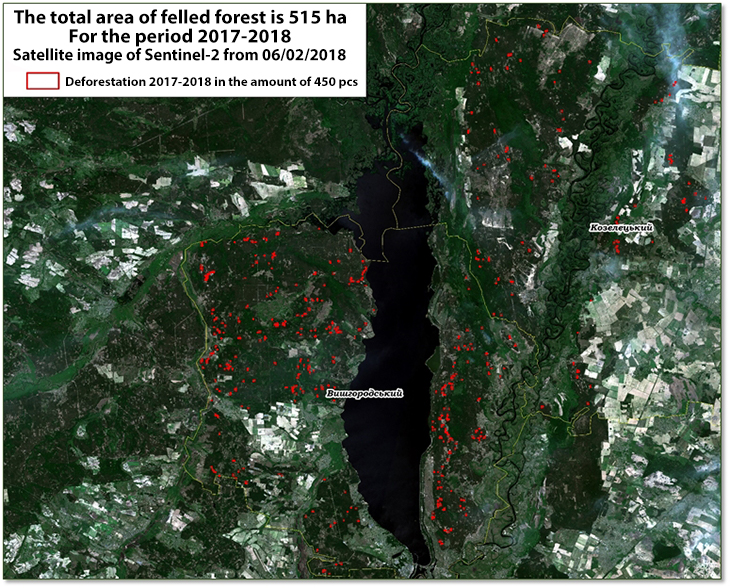
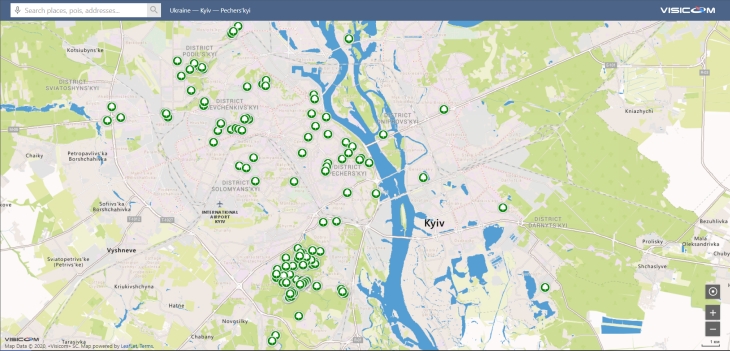
3. PERMANENT DATA UPDATE
A permanent data update allows forecasting of increasing and decreasing forestry areas depending on the natural causes and disasters and human activity.
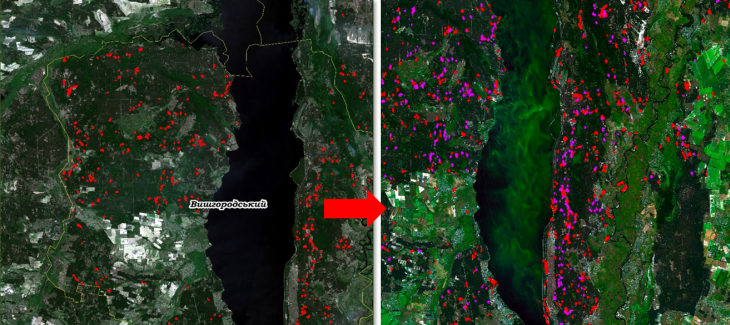 Image 4. Permanent detection of forest logging
Permanent detection of loggings using Sentinel images with simultaneous area's calculation (from 500 sq.km) let control any possible unauthorized loggings and perform the following tasks:
- Damage estimation and forecast;
- Statistic data collection regarding human's role in forestry areas reduction;
- Research the dependence of environmental indicators (in case of any) on areas of green spaces.
For illustrative purposes, please see the following image:
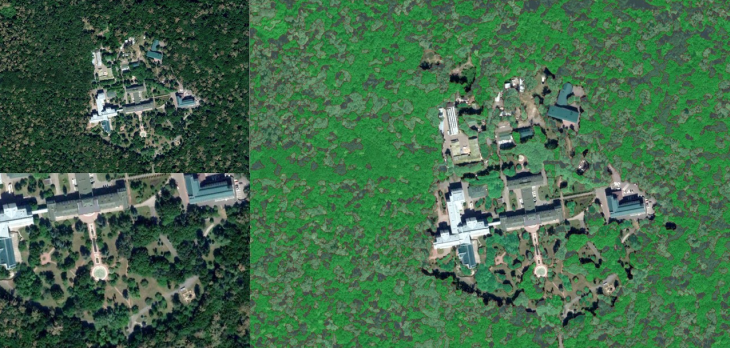
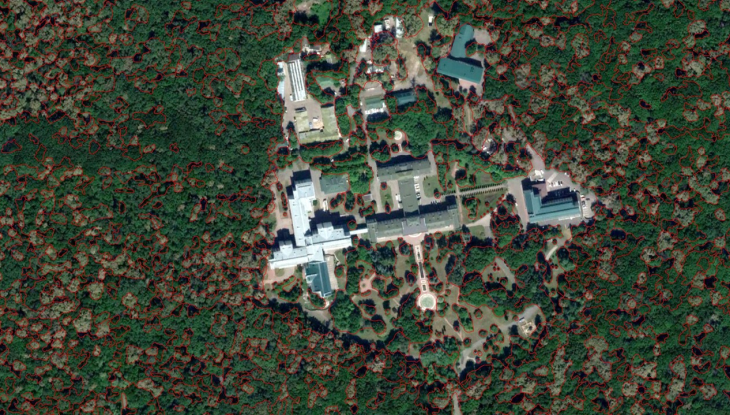
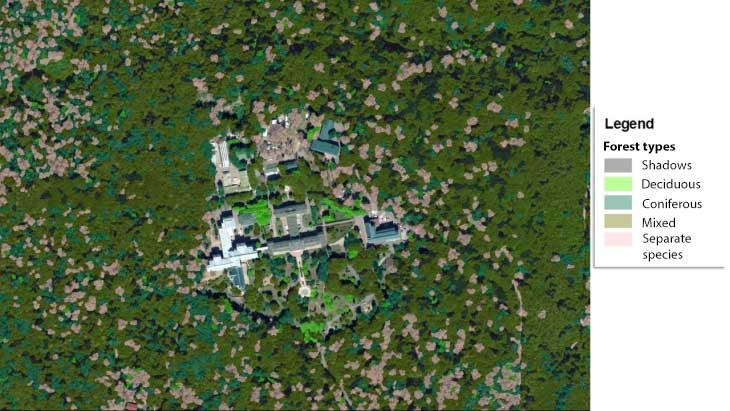
4. DETAILED MAPPING OF FORESTRY AREAS
Detailed mapping of forestry areas based on satellite images of 0.5m-2m resolution can be used for various purposes:
- Control of valuable trees growth;
- Prediction of flood's impact and consequences;
- Control of fire safety and forecast of damages;
- Other.
Vegetation detection featuring the clustered vegetation and classification by types (foliar, coniferous, mixed, unique tree species):
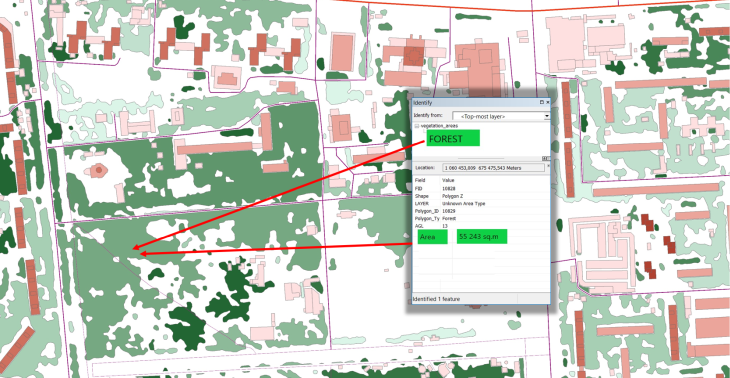
5. VEGETATION DETECTION IN URBAN AND SUBURBAN AREAS
This method implies to use the most accurate images of 0.3-1m resolution and is applicable in vegetation detection within city areas: parks, forested parks, gardens, square parks. For each detected parcel, the area is calculated (including bushes, lawns). In addition, the output data can be presented as a detailed map where the trees (up to every single separate tree) can be detected based on the images of high resolution only (HR resolution satellite images).
In its turn, it will give a possibility for:
- Registration of vegetation unit, even to within 1 tree;
- Accurate mapping of vegetation;
- Maintenance of various environment-oriented DBs (e.g. the DB of the oldest trees )
- Assessment of the state of the vegetation.
a) The technology of vegetation mapping under the urban setting
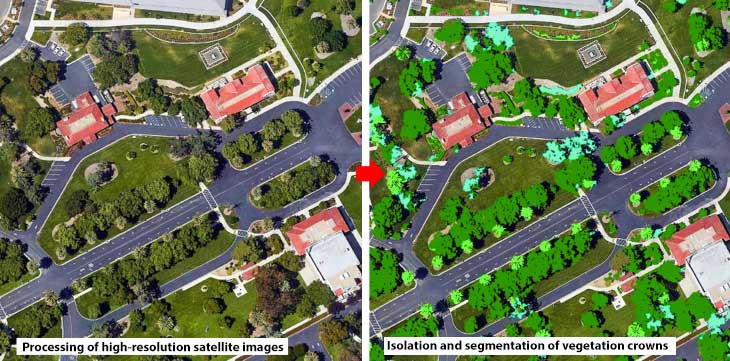
b) Generating of vegetation vector map: contours, vegetation type, and area