Recently, we created a comprehensive Population Map (PopMap) for Bangladesh, covering the entire country's 147,750 square kilometers. This project aimed to provide detailed insights into population distribution and density across various administrative units, leveraging advanced mapping techniques and official statistical data.
It's worth noting that Bangladesh stands among the world's most densely populated countries, with a populace exceeding 169 million individuals.
The Population Distribution Model is a crucial dataset for deploying, planning, and optimizing networks. It offers a comprehensive representation of land use and density ratios across diverse urban and city classes.
Key Applications include:
- Assessing market potential and prioritizing new deployments
- Defining coverage for strategic customers or critical areas
- Demonstrating spectrum conditions achieved through population coverage
- Conducting capacity simulations for planned network infrastructure
- Determining network priorities
- Establishing a nominal infrastructure budget
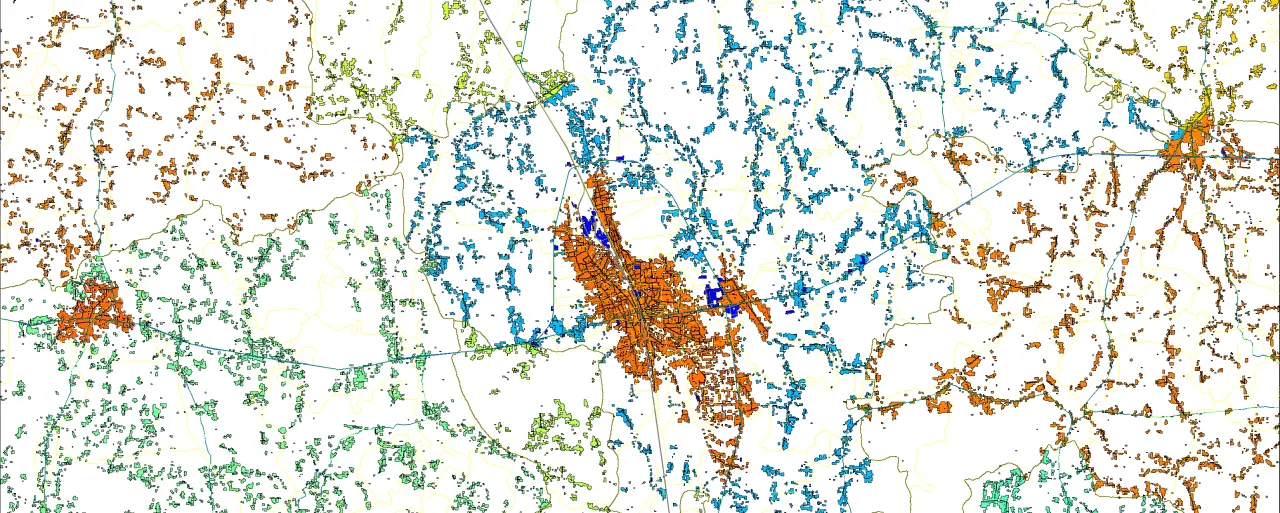
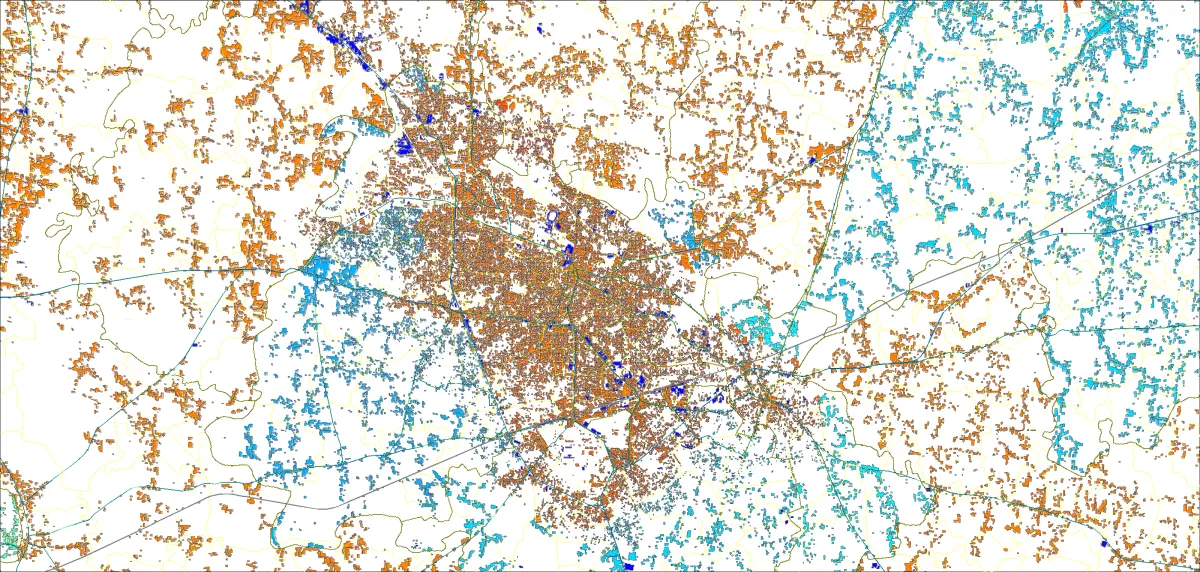
The Night Population Map (Static Model) produced for Bangladesh
offers density ratios between urban classes based on residential areas identified in census information. It utilizes two input layers for the Population Distribution Model: Clutter or Land Use models related to populated areas and experimentally obtained coefficients assigning population density proportions for different classes.
Factors considered for Population Map production include:
- Industrial zones: factories, plants, and ports
- Large office complexes and buildings
- Universities and colleges
- Villages distant from towns, cities, and industrial zones
- Suburb zones of large cities
Project Scope and Objectives:
The primary goal of the Population Map project was to deliver accurate and up-to-date population distribution data for Bangladesh, facilitating informed decision-making and resource allocation at national, regional, and local levels.
Project Details:
- Utilized Clutter Model with a resolution of 10m to delineate built-up areas
- Official 2022 census results from the Bangladesh Bureau of Statistics were integrated to ensure accuracy and reliability
- The last available 5-level administrative division was used as a key source
Administrative Division Levels:
- 1st level: Divisions
- 2nd level: Zilla (districts)
- 3rd level: Upazila/Thana (sub-districts)
- 4th level: Unions (councils)
- 5th level: Mouza (villages), containing comprehensive information on union, thana, district, and division affiliations.
Conclusion:
Night Population Maps (PopMaps) for Bangladesh were meticulously crafted in raster and vector formats, complete with detailed administrative boundaries.
The PopMap ensures accessibility and usability for a diverse array of stakeholders, ranging from government agencies to private enterprises.
By merging cutting-edge mapping technologies with authoritative statistical data, our project has yielded a valuable asset for urban planning, infrastructure development, and socio-economic analysis.
Data samples for testing are available upon request. For more information, please get in touch with us and describe your project requirements.

