
The quest for sustainable energy solutions has intensified the focus on solar power. Efficient use of the sun's energy requires precise planning and implementation, and this process is greatly facilitated by 3D digital mapping technology.
Here's why 3D digital maps are indispensable in the solar energy sector.
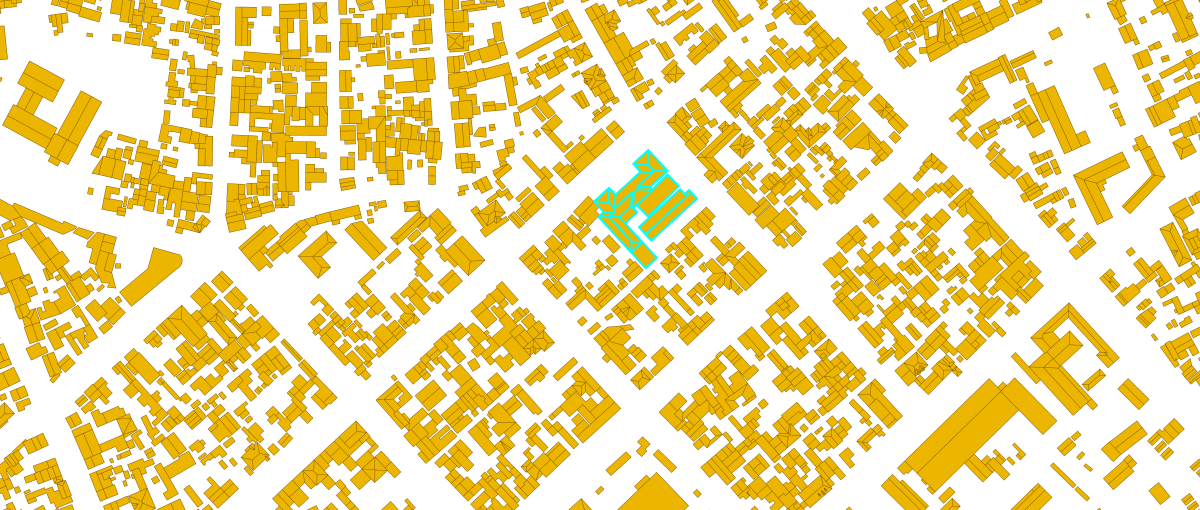
Selecting the right location for solar panels is crucial for maximizing energy output. 3D digital maps provide detailed topographical data, including the elevation and contours of the land. This information helps identify areas with maximum sun exposure and minimal shading throughout the year. By accurately modeling the terrain, stakeholders can pinpoint the best sites, ensuring that solar installations receive optimal sunlight and increase efficiency.
One of the critical factors affecting solar panel performance is shading. Even minor obstructions can significantly reduce energy production. 3D digital maps enable comprehensive shadow analysis by simulating the movement of shadows cast by surrounding objects such as buildings, trees, and other structures. This level of detail allows for the strategic placement of panels to minimize shading, ensuring consistent energy generation.
For large-scale solar farms, 3D digital maps are also indispensable. They aid in managing vast amounts of data and provide a clear, cohesive view of the entire project. This capability is essential for coordinating various aspects of the project, from initial site surveys to construction and ongoing maintenance. Visualizing the project in three dimensions ensures that all stakeholders have a clear understanding of the project's scope and progress, facilitating better decision-making and project management.
For example, the International Renewable Energy Agency (IRENA) a lead global intergovernmental agency for energy transformation, developed the SolarCity simulator – an online platform that assesses the potential for installing solar photovoltaic systems on rooftops.
IRENA's simulator use demonstrates a practical approach that relies on site-specific solar resource data, three-dimensional building footprints obtained through satellite imagery, and a robust electricity production model to calculate hourly and annual electricity output.
VISICOM 3D geodata is developed for companies that specialize in creating solar cadasters, and is also used to assess the photovoltaic potential of building roofs.
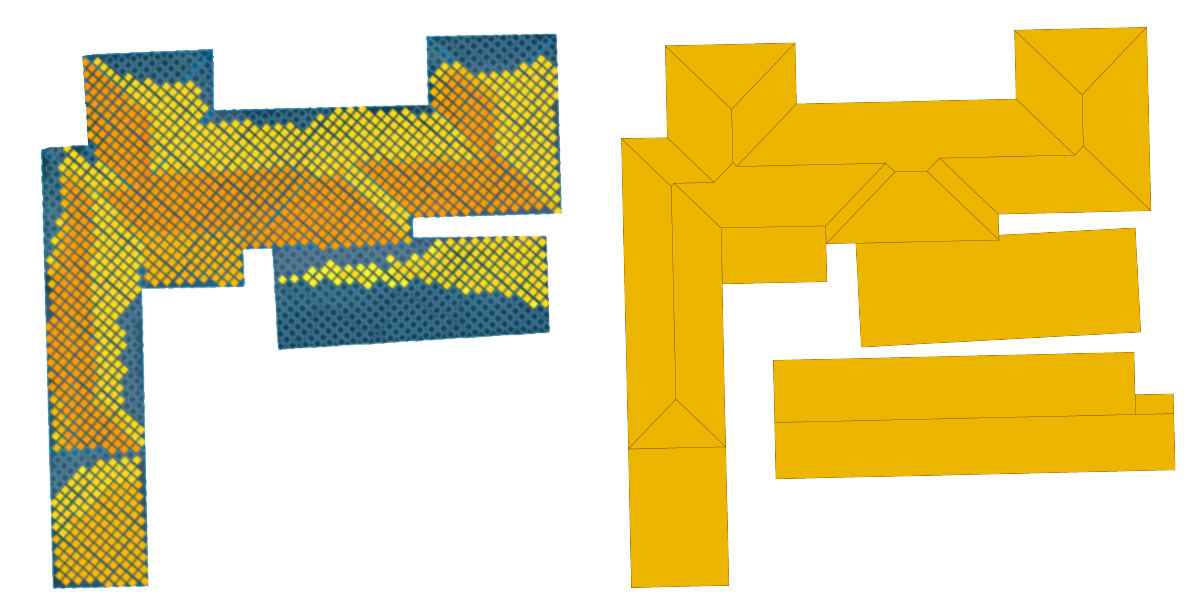
We provide a set of layers, along with a custom roof metadata base:
- AMSL (Above Mean Sea Level)
- AGS (Above Ground Level)
- Area of a roof element
- Tilt/Elevation angle of a roof element relative to the ground
- Azimuth angle (horizontal angle between the center line of a roof element and North)
- X,Y,Z coordinates of a central point of a roof element (centroid coordinates)
The complete list of layers includes:
- Digital Terrain Model
- Digital Surface Model
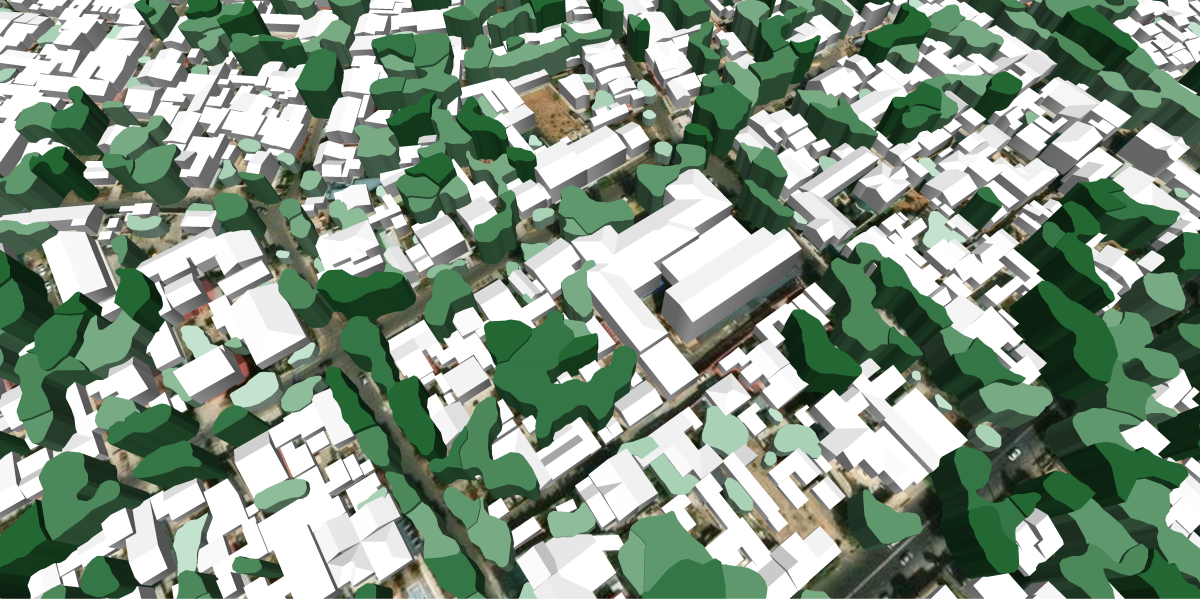
- 3D Buildings LOD 2
- 3D Vegetation crowns
- Orthorectified imagery
The solar cadaster created using 3D VISICOM data is an ideal solution for obtaining economic indicators for photovoltaic installation projects.
We have prepared for you concise information about digital maps for solar energy.
It can be confidently stated that in the rapidly developing field of solar energy, using 3D digital maps is not just beneficial but essential. From site selection and design to performance monitoring and maintenance, these advanced tools enhance every stage of solar project development. As the demand for renewable energy continues to grow, the precision and efficiency provided by 3D digital mapping will play a pivotal role in the successful implementation of solar energy solutions worldwide.

