With the advancement of technology, geodata about land features has become crucial for understanding the impact of climate change on various regions. This data enables more accurate modeling and forecasting of climate risks, supporting critical decision-making at both governmental and corporate levels.
Using Land Data for Climate Risk Modeling
Land data encompasses information about topography, soil types, water resources, and other natural features that influence local climates and vulnerability to climate change. For instance, mountainous regions are prone to erosion and landslides, especially during heavy rainfall. By leveraging geodata, it becomes possible to predict areas at risk for such events and implement preventative measures to protect infrastructure and communities.

The Role of Natural and Artificial Land Cover in Understanding Climate Risks
Land cover, including vegetation, urban areas, and water bodies, directly impacts factors such as temperature, humidity, and flood risks. Dense forests, for instance, act as natural barriers, preventing landslides and stabilizing soil, while urban zones are vulnerable to heat waves due to the "urban heat island" effect. Land cover data supports urban planners in designing new green spaces to mitigate the risks of extreme temperatures and flooding, fostering climate resilience in both natural and built environments.
Advantages of 3D Data in Climate Change Planning and Adaptation
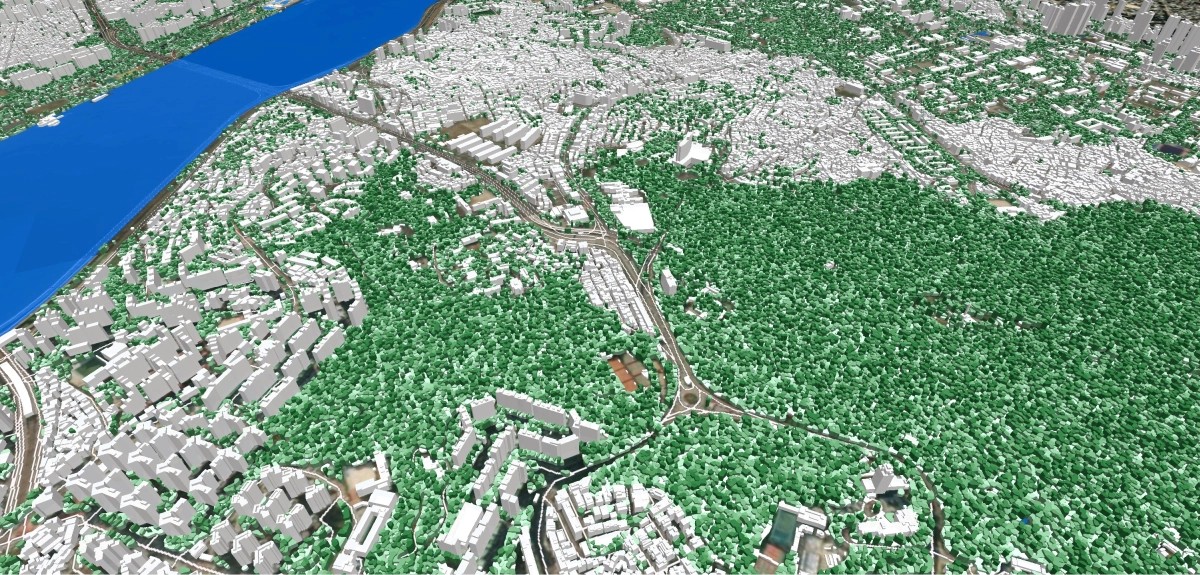
3D maps provide enhanced detail, capturing building heights, terrain, and vegetation density, which are crucial for planning evacuation routes, drainage systems, and disaster prevention measures. For example, they can identify optimal locations for rainwater reservoirs to prevent flooding in low-lying areas.
Recent devastating floods in Spain (e.g., Spanish floods 2024) highlight the urgency of analyzing climate risks. Geospatial data helps pinpoint vulnerable zones, implement preventive measures, and design effective evacuation plans and water management systems to mitigate damage and protect communities.
Using GIS for Climate Risk Analysis
Geographic Information Systems (GIS) enable the integration and analysis of multilayered data to identify climate risks and develop adaptation strategies. For example, GIS supports location planning by considering risks like severe storms or droughts. This is particularly crucial for the agriculture, construction, and infrastructure sectors.
In summary, comprehensive land and coverage data are essential for modern planning in the context of climate change. With 3D technologies, risks can be analyzed more accurately, fostering adaptive strategies that enhance resilience and safety for communities and businesses.
VISICOM geodata is used in GIS to visualize and monitor climate changes. We support projects related to forestry, agriculture, solar energy, flood tracking, hydrography, and more. We provide accurate and up-to-date geodata for environmental management forecasting and mapping.
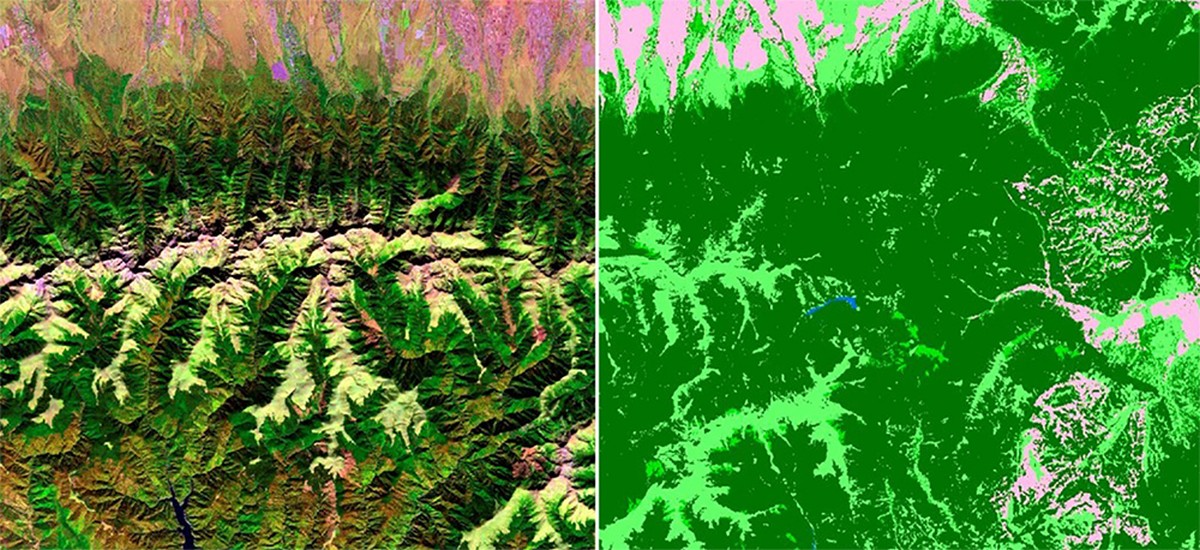
For example, one of our completed projects was the creation of terrain, clutter, and vegetation height clutter layers for a nature reserve in the Ukrainian Carpathians. The project's goal was to preserve forest heritage, specifically monitoring changes in vegetation cover and mapping deforestation. Since the main objective was to map the dynamics, the project lasted for three years and was based on processing stereo pairs of satellite images from Spot 6 and 7.

We use the most advanced technology to provide the environmental management sector with the most up-to-date geospatial data layers:
- 3D buildings produced from high-resolution satellite images, Lidar data, and air photos are the essential and mandatory background for spatial analysis of climate change, disaster risk management, response, and recovery efforts both in the cities and countries scale.
- 3D vegetation is diverse in nature and can be presented differently in the satellite image depending on various types, colors, heights, and seasons, providing a digital twin of green infrastructure
- Land Use classification clutter is a primary input for the prediction of different types of environmental management – both human activity and natural processes. Our Land Use layer provides a high level of detail in urban and suburban areas that allows recognition, visualization, and analysis of the changes both in the natural and man-made environment.
- Water objects include ▪ oceans ▪ seas ▪ bays ▪ estuaries ▪ lakes ▪ rivers ▪ streams ▪ reservoirs ▪ springs ▪ waterfalls ▪ rapids ▪ etc.
Depending on your project demands, we can divide all the hydrographic objects into groups and classes by type of water (salt, fresh, etc.) and nature of the water object, providing also various supporting information like length of coastline, area of enclosed water bodies, etc.
- Elevation data (DTM, DSM, DEM) - substantial mapping layer to perform effective geospatial analyses for Natural Resource Mapping, Disaster Prediction, Solar Resource Assessments
- Population maps (Pop Maps) based on the latest Census enable the process of population distribution values with the level of detail from countrywide areas to separate cities.
If you would like more information about our data for climate monitoring, environmental forecasting, or any other geospatial services, please don’t hesitate to contact us.


